At ~05:00h UTC on 15 January 2022, the Hunga Tonga Hunga Ha’apai undersea volcano erupted. The eruption was probably followed by a massive undersea landslide, which set tsunami waves out across the Pacific Ocean. This time translates to ~21:00h PST on Friday 14 January, and for the rest of this entry all times and dates will be reported in California time. The eruption and landslide happened in the early morning in Tonga, which was the previous evening here in California.
I woke up on Saturday 15 January (yesterday, as I write this on the 16th) to reports of tsunami warnings for the entire Pacific coast of North America. The first waves were expected to hit the Monterey Bay area around 07:30h. Knowing that we are in spring tides now and that the low low tide (LLT) would be at 15:35h, I back-calculated the preceding high tide (the high high tide, or HHT, for the day) to be around 08:30h. Hmm. High tide plus tsunami surge could equal interesting things to see! And yes, as we were warned not to go down to the ocean, I planned to remain above it all and observe from the bluffs.
What the instruments measured
The volcano erupted first, and caused the landslide. When the massive displacement of water occurred in the ocean, it sent pressure waves through both the ocean and the atmosphere. But before that, the volcanic explosion itself created a pressure wave in the atmosphere. And it happens that the barometer in our weather station caught the pressure anomaly! At 04:04h on 15 January, about seven hours after the eruption, the weather station measured a spike in atmospheric pressure (circled in red in the bottom panel). Our weather station records pressure only every five minutes, so the actual spike may be a bit higher than what was recorded.

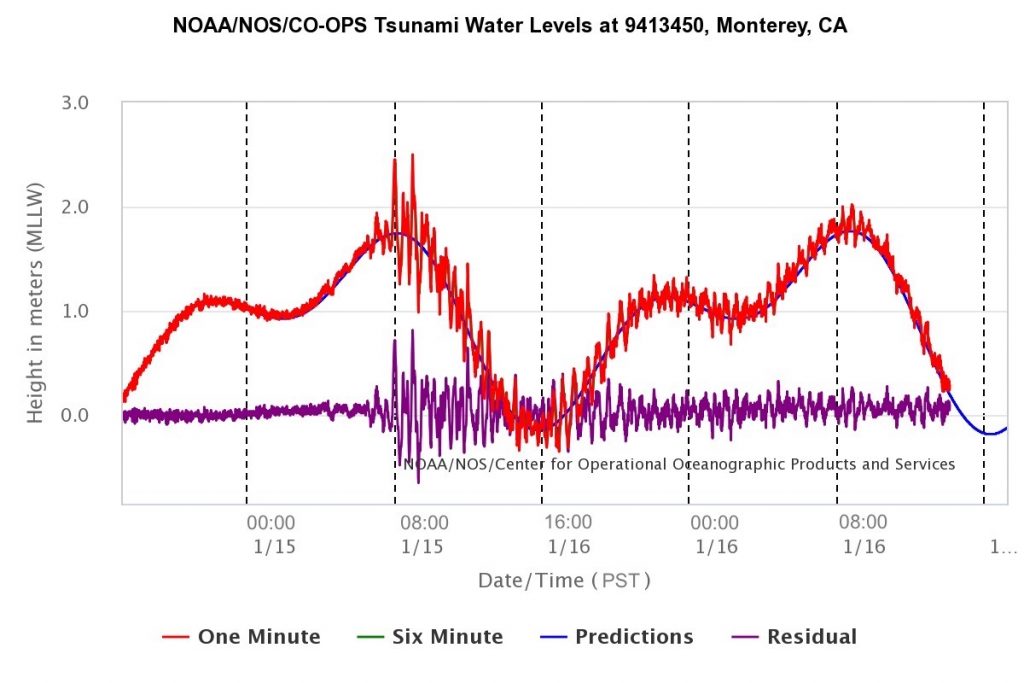
The National Oceanographic and Atmospheric Administration (NOAA) has tsunami stations established on the entire coast of the U.S., as well as earthquake monitoring stations elsewhere along the Pacific ring of fire. The tsunami station at Monterey measured sea level anomalies due to the tsunami waves striking the coast, starting at about 07:00h, as seen below.

This kind of chart is a little different from what you’re probably used to, so let me explain what it shows. You have time and date along the X-axis. The blue line, which is hard to see because it is mostly obscured by the red line, is the predicted sea level; note that it follows the usual trajectory for the tides we have in this area, with two high tides and two low tides every day. The jagged red line is the interesting part. It shows the anomalies, or how the actual sea level deviates from the predicted sea level. There are both positive and negative anomalies. These anomalies are the tsunami surges that hit the monitoring buoy. Positive anomalies are the pressure waves striking the buoy (i.e., the crests of the wave), and negative anomalies are the pauses between surges, or the troughs of the wave. The first large anomaly was about 0.7 meters above the predicted sea level.
Imagine tossing a pebble into a calm pond. When the rock hits the water it sets up a series of pressure waves that emanate in all directions from the point of impact. If you watch those waves, or ripples, you notice that over time they diminish in size until eventually you don’t see them anymore.
A tsunami is a similar phenomenon, only ginormously magnified. The underwater landslide displaces a huge amount of water, which then surges away in all directions. These tsunamis travel across thousands of kilometers of open ocean, where they may not make much difference in sea level. But as they approach land they behave like other waves do: they slow down and get taller. When they hit the continental shelf, they surge up coastal waterways and flood any low-lying land they encounter.
And there isn’t only one surge. As you can see in the NOAA chart, surges and relaxations occurred throughout the entire day. The purple line indicates the same anomalies as the red line, only they are shown on a single horizontal line instead of on the wave of the blue line. This makes it easier to see how the magnitude of the deviations decreases over time.
What I saw
Double-checking the NOAA tide chart for Santa Cruz, I saw that the HHT would be +1.7 meters at 07:59h. I managed to get myself down to the marine lab, do my chores, and scurry out to Younger Lagoon at about 08:45h. Don’t worry, I didn’t have time to go down onto the beach, but watched events from the bluff, where I had a better view anyway. Remember, we had a high tide coinciding with the oncoming tsunami surge, so the potential was there for something interesting to happen. Now, a +1.7 meter (= 5.5 feet) isn’t an extremely high tide. But combined with a tsunami surge, maybe that would be enough to flow over the sand berm into the lagoon.
And that’s what happened. From my position on the bluff I recorded this video:
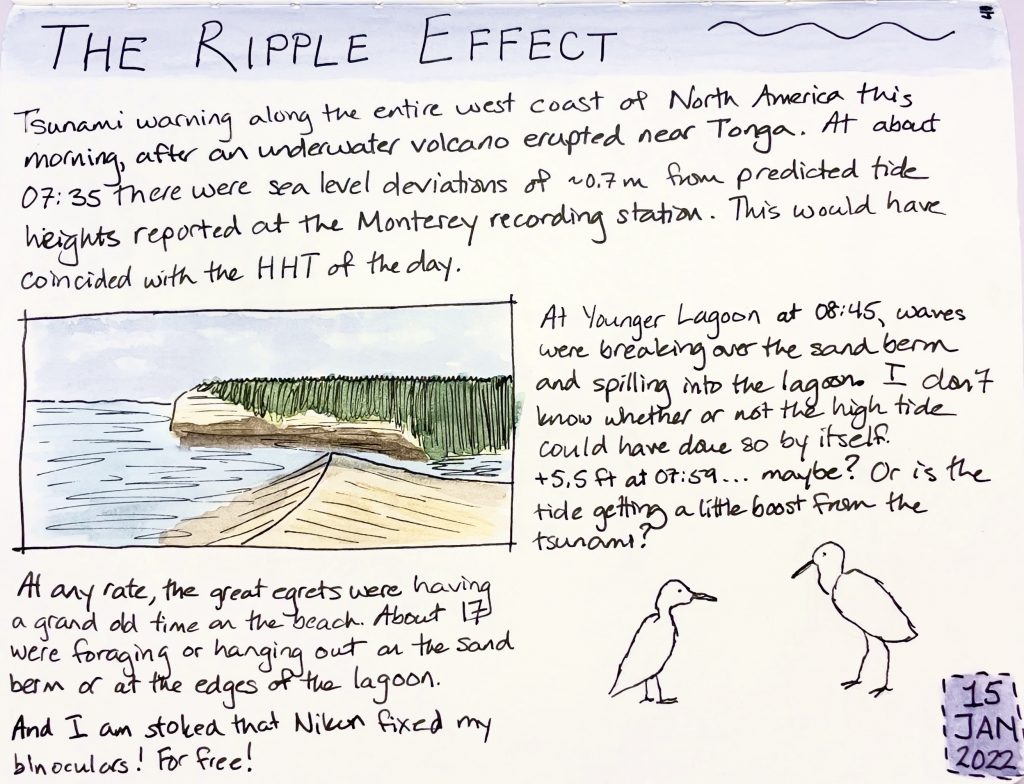
And here’s my nature journal entry:

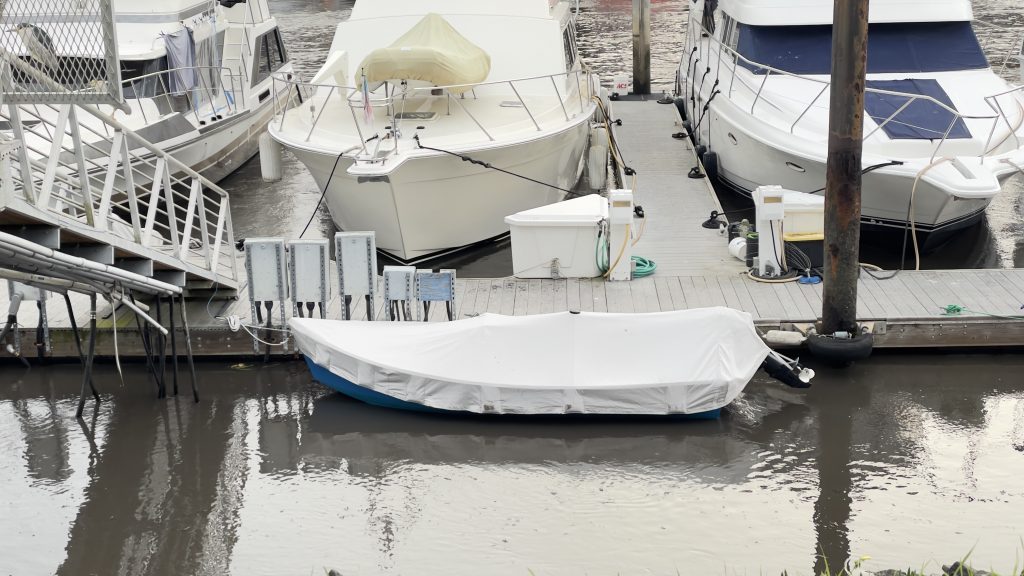
Things were pretty exciting at the Santa Cruz Small Craft Harbor, too. All day, people were recording the tsunami surges as they rushed up the harbor from Monterey Bay. Unlike the tsunami in 2011, which tore up both docks and boats, causing extensive damage, yesterday’s tsunami was quite mild. I had already made plans for the day and didn’t get down to the harbor to check out the action until late in the afternoon. My friend, Murray, built a little boat, Scherzo, who lives in the upper harbor. Scherzo didn’t exist in 2011 so we don’t know how she would have weathered things. She was floating happily when we went to see her yesterday, although she did seem to be sitting rather low in the water. She probably took on water over her transom during the biggest tsunami surges.
Scherzo is the sleek little craft on the near side of this dock. She is blue with a white cover.

2022-01-15
© Allison J. Gong
The harbor patrol had blocked access to the docks so they could inspect them for structural damage. I assume, but don’t know for sure, that slip renters were able to check on their boats today.
We were at the harbor at 16:30h yesterday. Sea level was still noticeably rising and falling, and even a minute of watching was rewarded with fairly drastic changes. Since we were not allowed onto the docks I was unable to record good footage of how quickly water was moving in the main channel. However, in the side channel where Scherzo is tied up we could watch the water drain. In this video, keep an eye on that rock that looks like a shark fin, near the middle of the frame.
What other people saw
In one of those inevitable consequences of any public safety announcement, the effect of a tsunami warning is to attract people to the beach. I know that many surfers headed out to surf the tsunami, and a lot of people recorded the tsunami from bridges and other places. Here are just a few of the YouTube videos showing the tsunami in the Santa Cruz area.
Video #1: Drone footage of the tsunami pushing into the mouth of the harbor and up the main channel. You can clearly see the green water from Monterey Bay pushing its way through the muddier water of the harbor itself. And the poor dredge sure did take a beating!
Video #2: This video was shot from the Murray Street bridge, looking south at the lower harbor
So yeah, things were pretty exciting here. But the important thing to remember is that what was a source of entertainment and mild concern here in California, caused tremendous damage in Tonga and neighboring islands. Volcanic ash is settling over the island to the depth of several centimeters, fouling fresh water supplies. The ash is also clouding the air and darkening the sky. Communications have been disrupted, and it is unknown how many casualties resulted from the eruption and ensuing tsunami. Australia and New Zealand have begun deploying aircraft to assess the damage, but it will be a while before we know how bad things really are. Drinking water does seem to be the most pressing need for Tongans and inhabitants of other affected islands.
I imagine that in the coming days there will be opportunities for us to help those who need it. If you can contribute, please do so.
